NODES 2022 : Genealogy with different graph technologies for data collection & visualization
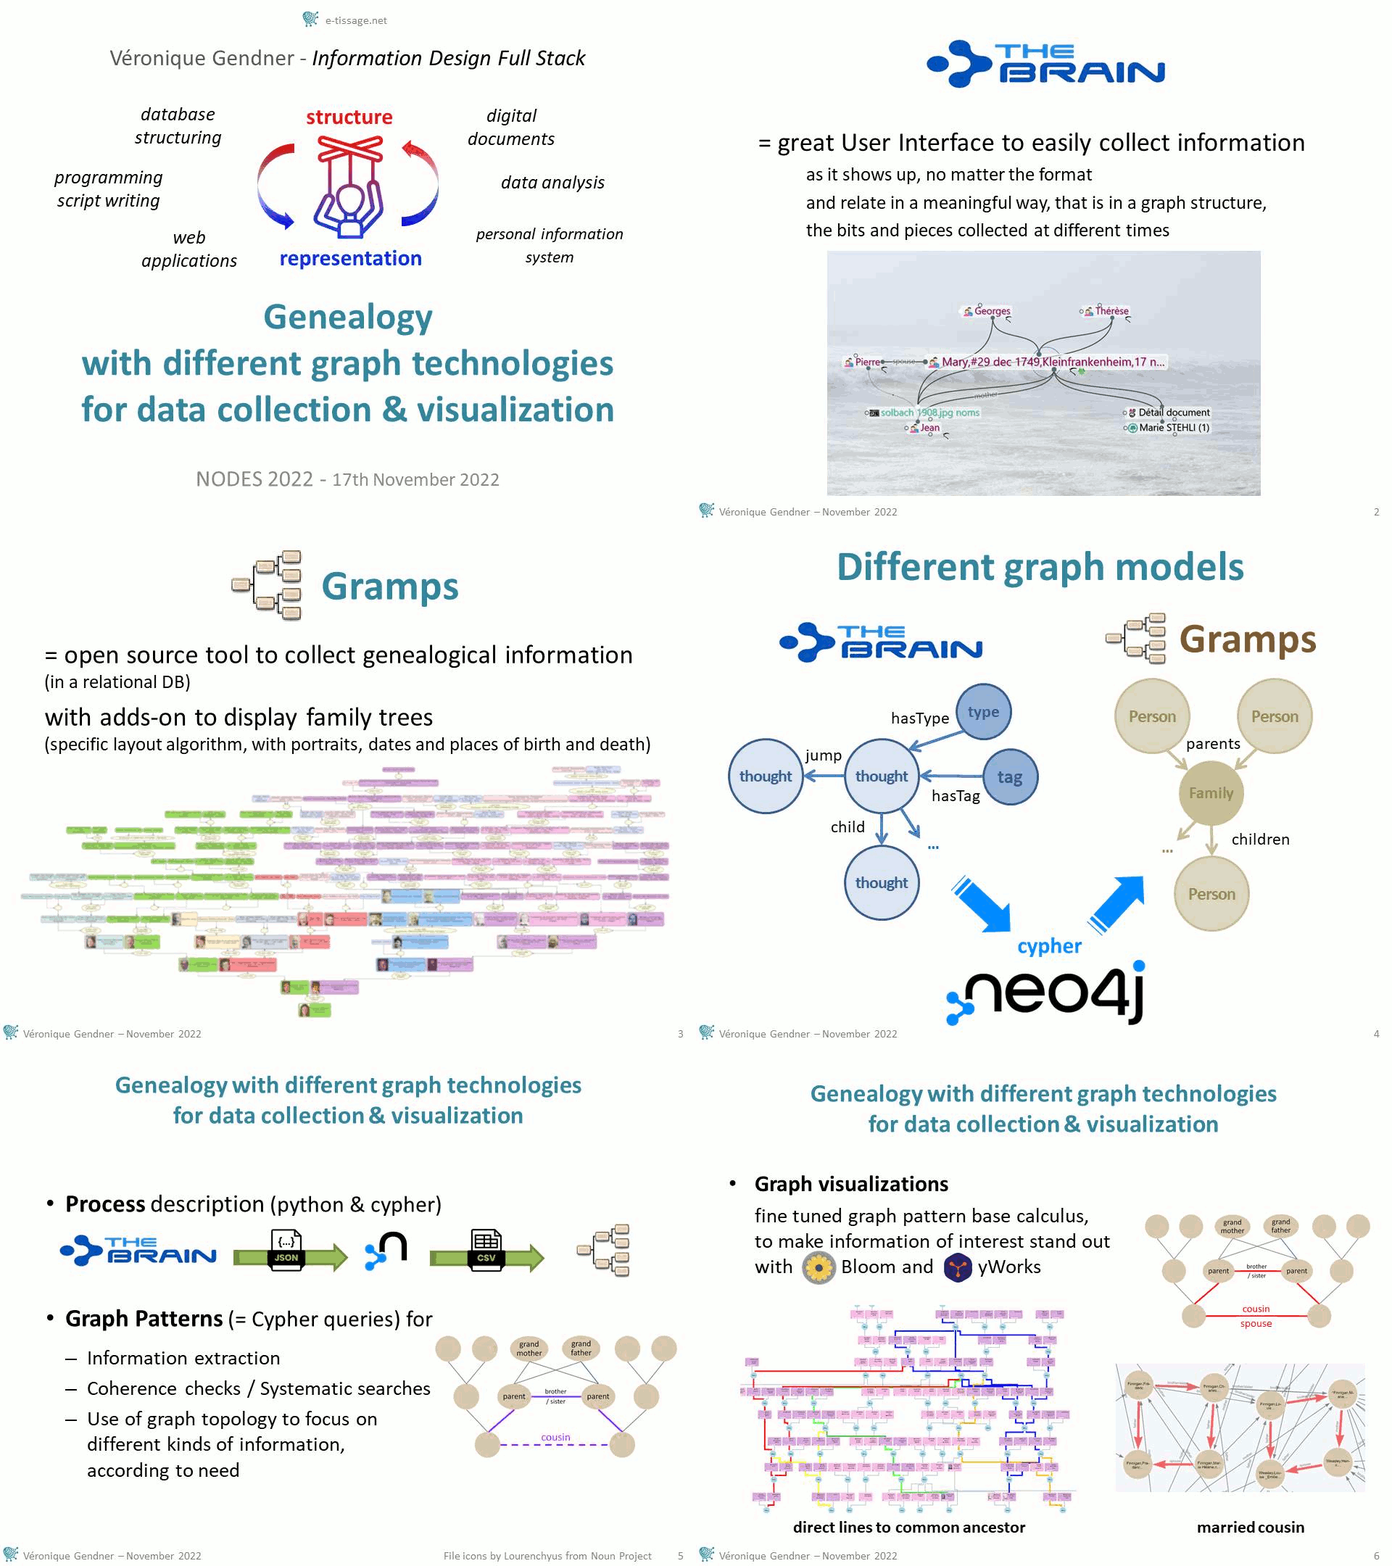
Graphs are a very interesting structure to get the best of human thinking combined with automatic processing. Through a very intuitively graph based use case – genealogy – the following presentation at the Nodes 2022 conference takes genealogical researches as an example to illustrate possibilities that can be applied to many domain of research. It is demoing several graph issues and technologies, from data collection to visualization, including data transfer from one app to another:
- documentation collection, in a graph structure, with TheBrain Technologies application,
- Gramps visualizations based on a family tree specific layout algorithm
- Bloom for visual and interactive exploration of data structured in graph and
- yWorks to make precisely selected information of interest, stand out on a graph display
- as well as Neo4j graph database as a pivot technology, to make use of graph topology and graph pattern matching
Data collection and export/import process from TheBrain to Gramps via Neo4j are presented, graph models are discussed.

TheBrain is a great User Interface to collect scraps of information as they show up in no specific order and easily relate them in a meaningful way, that is in a graph structure.
It’s great for data collection, but global visualization of the graph is not appropriate, for example to visualize remote common ancestors.
Gramps is an open source genealogy tool that can produce visualizations based on a family tree specific layout algorithm, it can also display a portrait when available, as well as dates and places of birth and death because they are essential to keep track of who you‘re dealing with, as the data set becomes larger.
The problem was TheBrain graph model is not the same as the one used in Gramps, so Neo4j has been used as a pivot graph technology to convert the data graph structure, with a Python script to operate the transfer.
Visualization issues and solutions, like fine-tuned calculus to make information of interest stand out on a graph display will also be presented (Bloom and yWorks), as well as different interesting uses of graph patterns, that is graph database queries.
04’30 TheBrain demo : documentation collection, in a graph structure (uncut version of TheBrain demo)
11’30 TheBrain limits
12’50 Gramps visualization and data format
14’58 Neo4j pivot data model
17’05 data transfer process
17’50 generating visualizations with Gramps and Gramps limits
19’10 use of graph topology
21’10 Bloom demo of visual and interactive exploration of the data (stand alone version of Bloom demo)
26’30 yWorks demo to make precisely selected information of interest, stand out on a graph display (stand alone version of yWorks demo)
33’50 wrap up and questions
 alerte email - nouveaux articles
 fil RSS - nouveaux articles
 Véronique Gendner, e-tissage.net