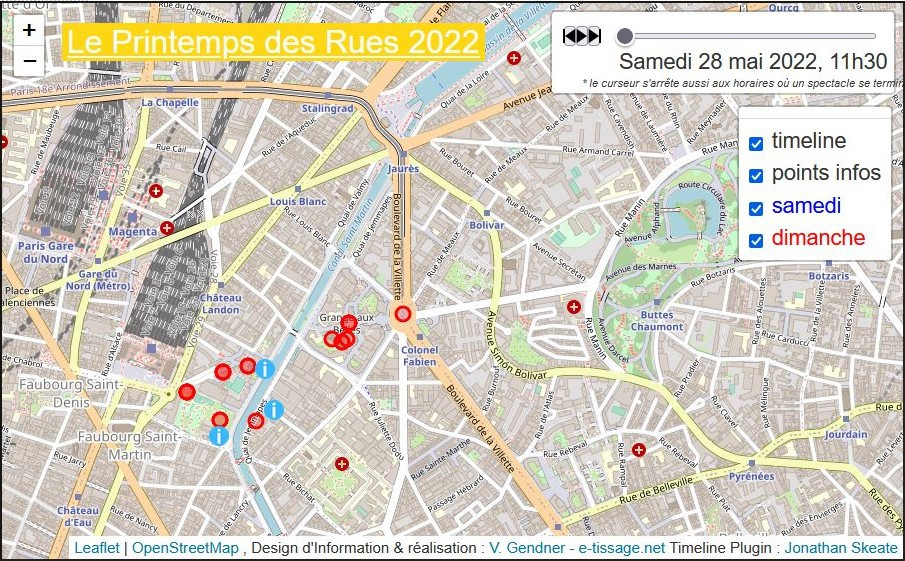
Quoi, où ? mais aussi quand ? une carte avec un curseur de temps (timeline)
Avoir la bonne clé d’accès à l’information est essentiel pour attraper les informations dont nous avons besoin. Les outils numériques ont l’énorme avantage de permettre des représentations avec plusieurs clés d’accès. La création d’une représentation numérique adaptée passe donc par l’identification des clés d’accès utiles. Voyons par exemple, le cas d’un festival qui présente des spectacles dans différents lieux.
 Lire la suite »
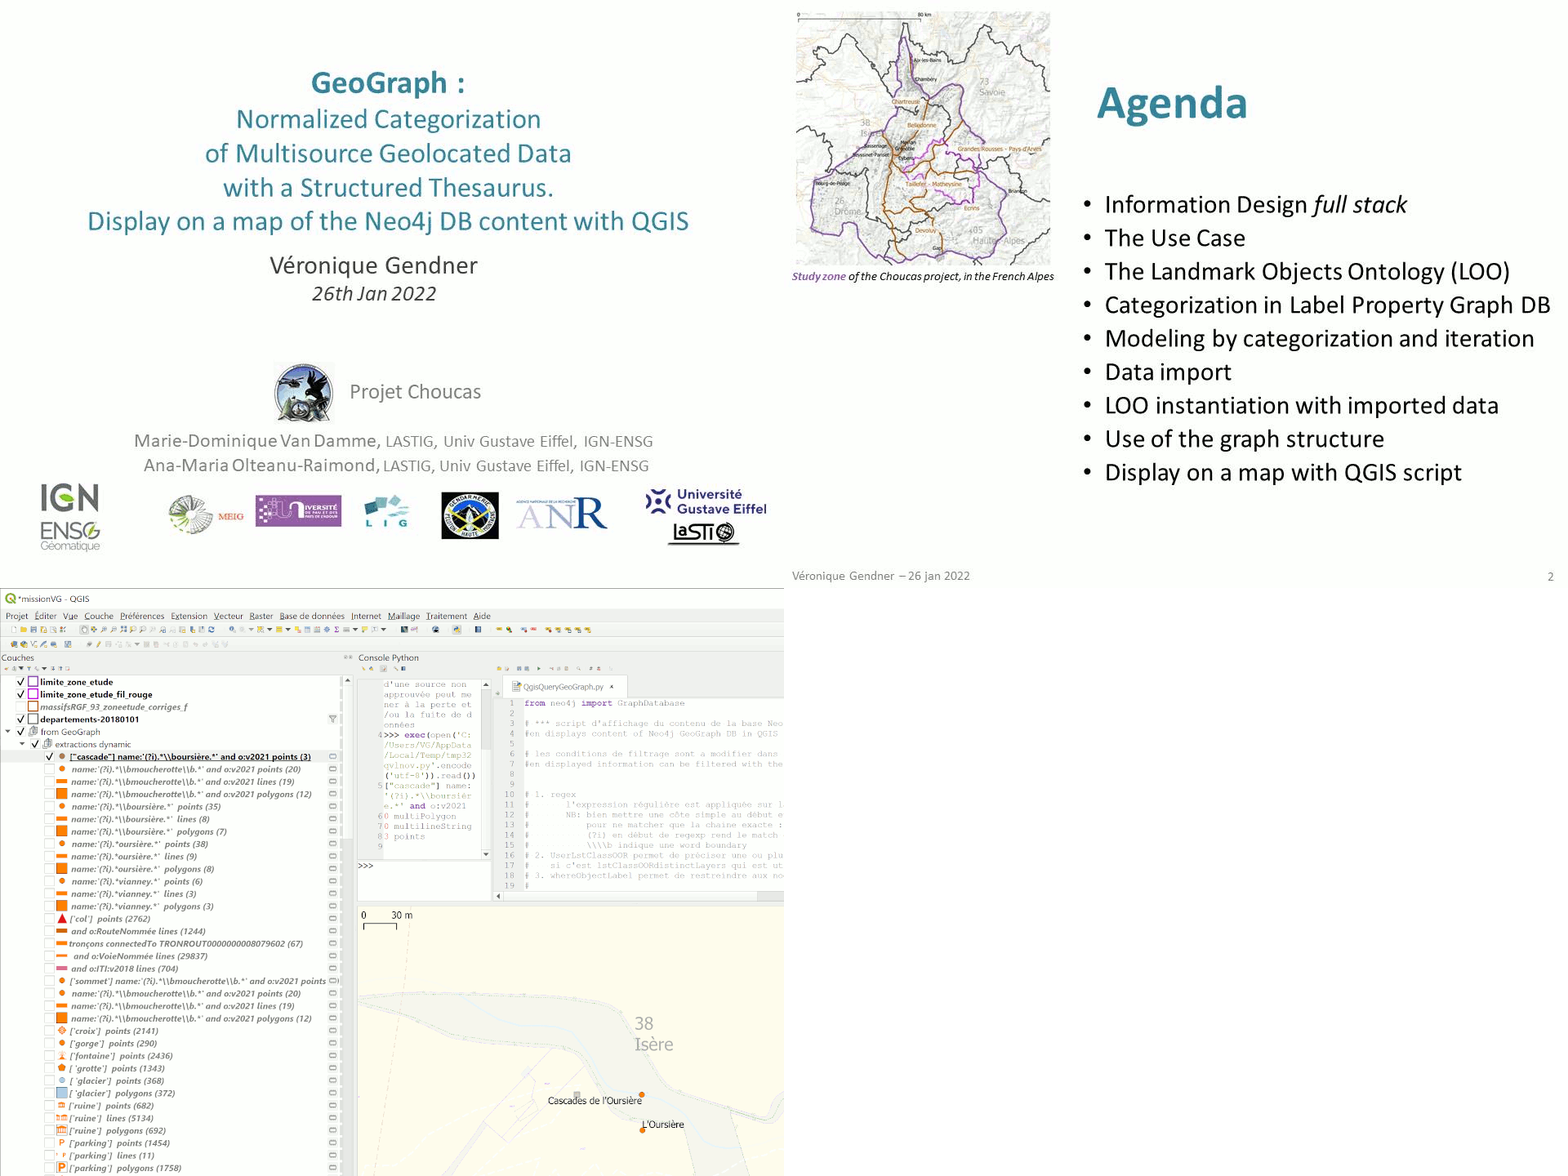
GeoGraph : Normalized Categorization of Multisource Geolocated Data
How GeoGraph, a multisource database of geolocated objects has been build, and how objects categorization is normalized with the Landmarks Objects Ontology build for the Choucas project. We will look into how the graph structure can be used in this context and demo how results of database queries can be displayed on a map, with a QGIS script.

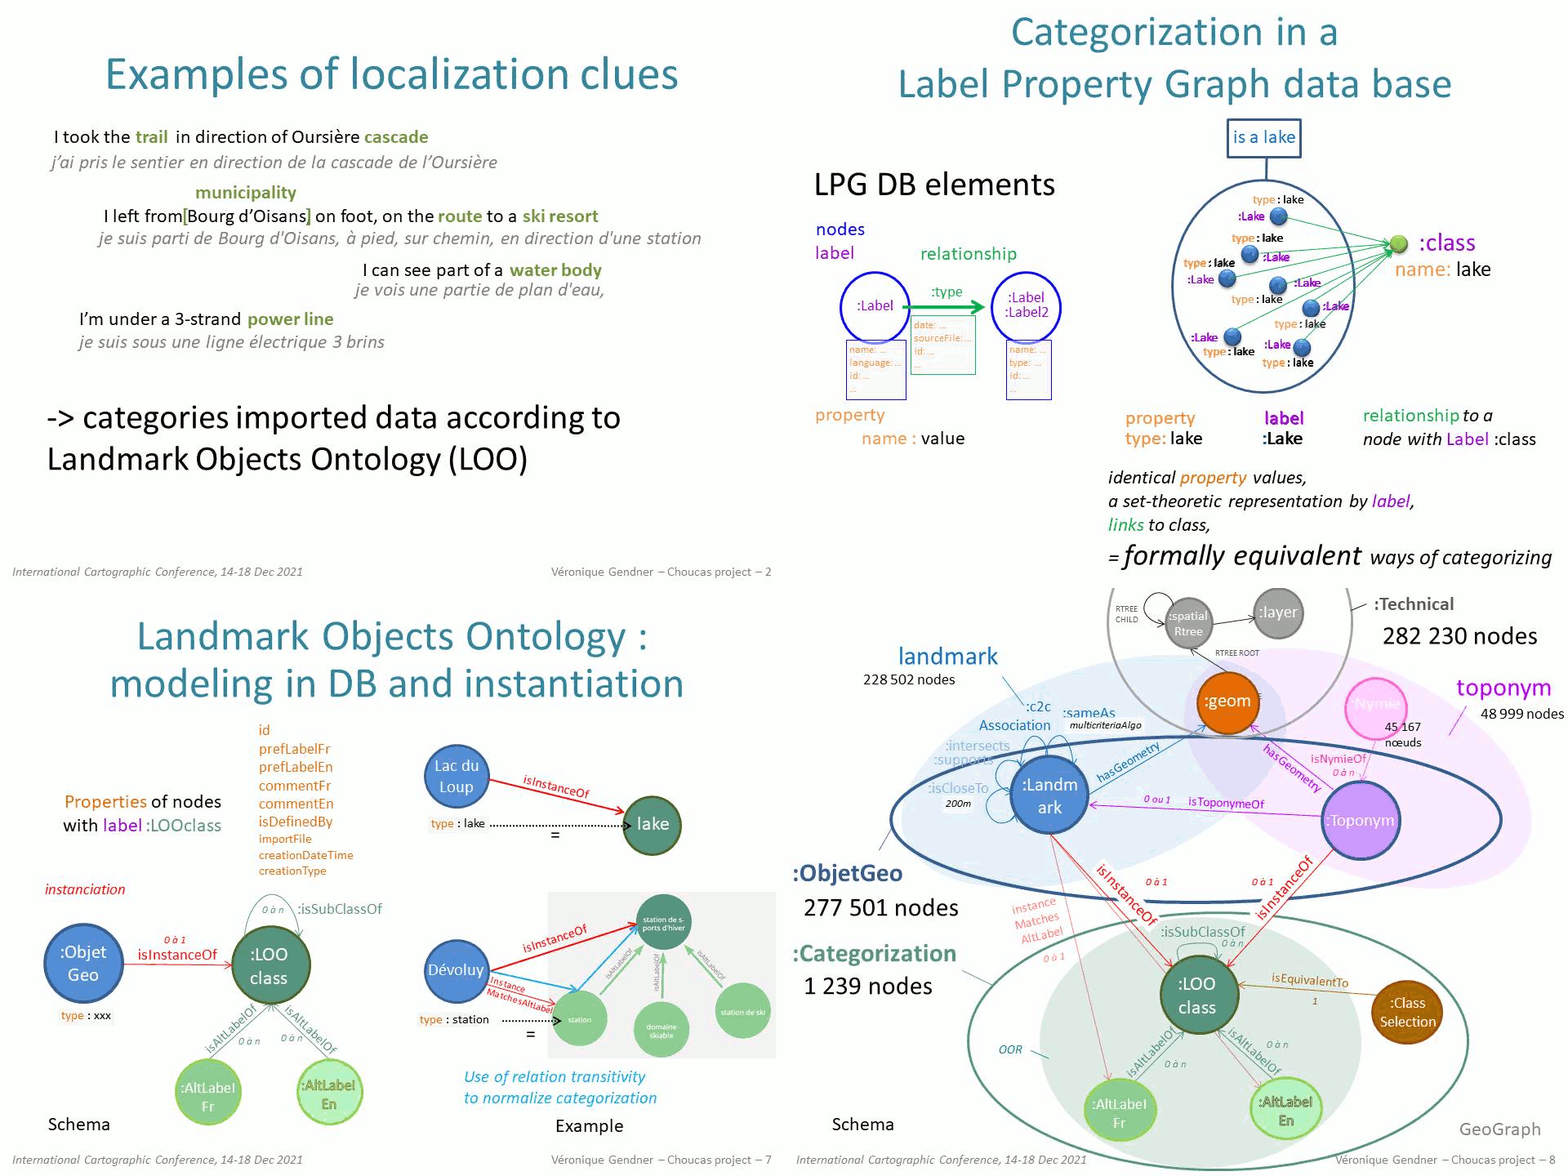
GeoGraph : Modelling and building a graph database of multi-source landmarks to help emergency mountain rescuers
The purpose of the Choucas research project is to come up with methods, tools and resources, to help mountain rescue team localise victims, when answering emergency calls. In this context, we have built a graph data base with the Neo4j Label Property Graph (LPG) technology, that integrates several sources of geolocated objects. Some data comes from the national mapping agency (IGN BDTOPO), others, like routes from crowdsourcing websites. Categorization of multi-source imported data has been normalized by an instantiation process based on the Landmarks Objects Ontology (OOR) that had previously been produced by the project team.
The flexibility of graph databases helps make the right modelling choices by progressively taking into account problems observed in the data as well as researchers and users feedback and new needs.
A more in depth presentation of this work, with a demo of a python script to display the content of the database on a map, with QGIS can be seen here.

Here is the presentation of this work done at the International Cartographic Conference, on 15th Dec. 2021 : Lire la suite »
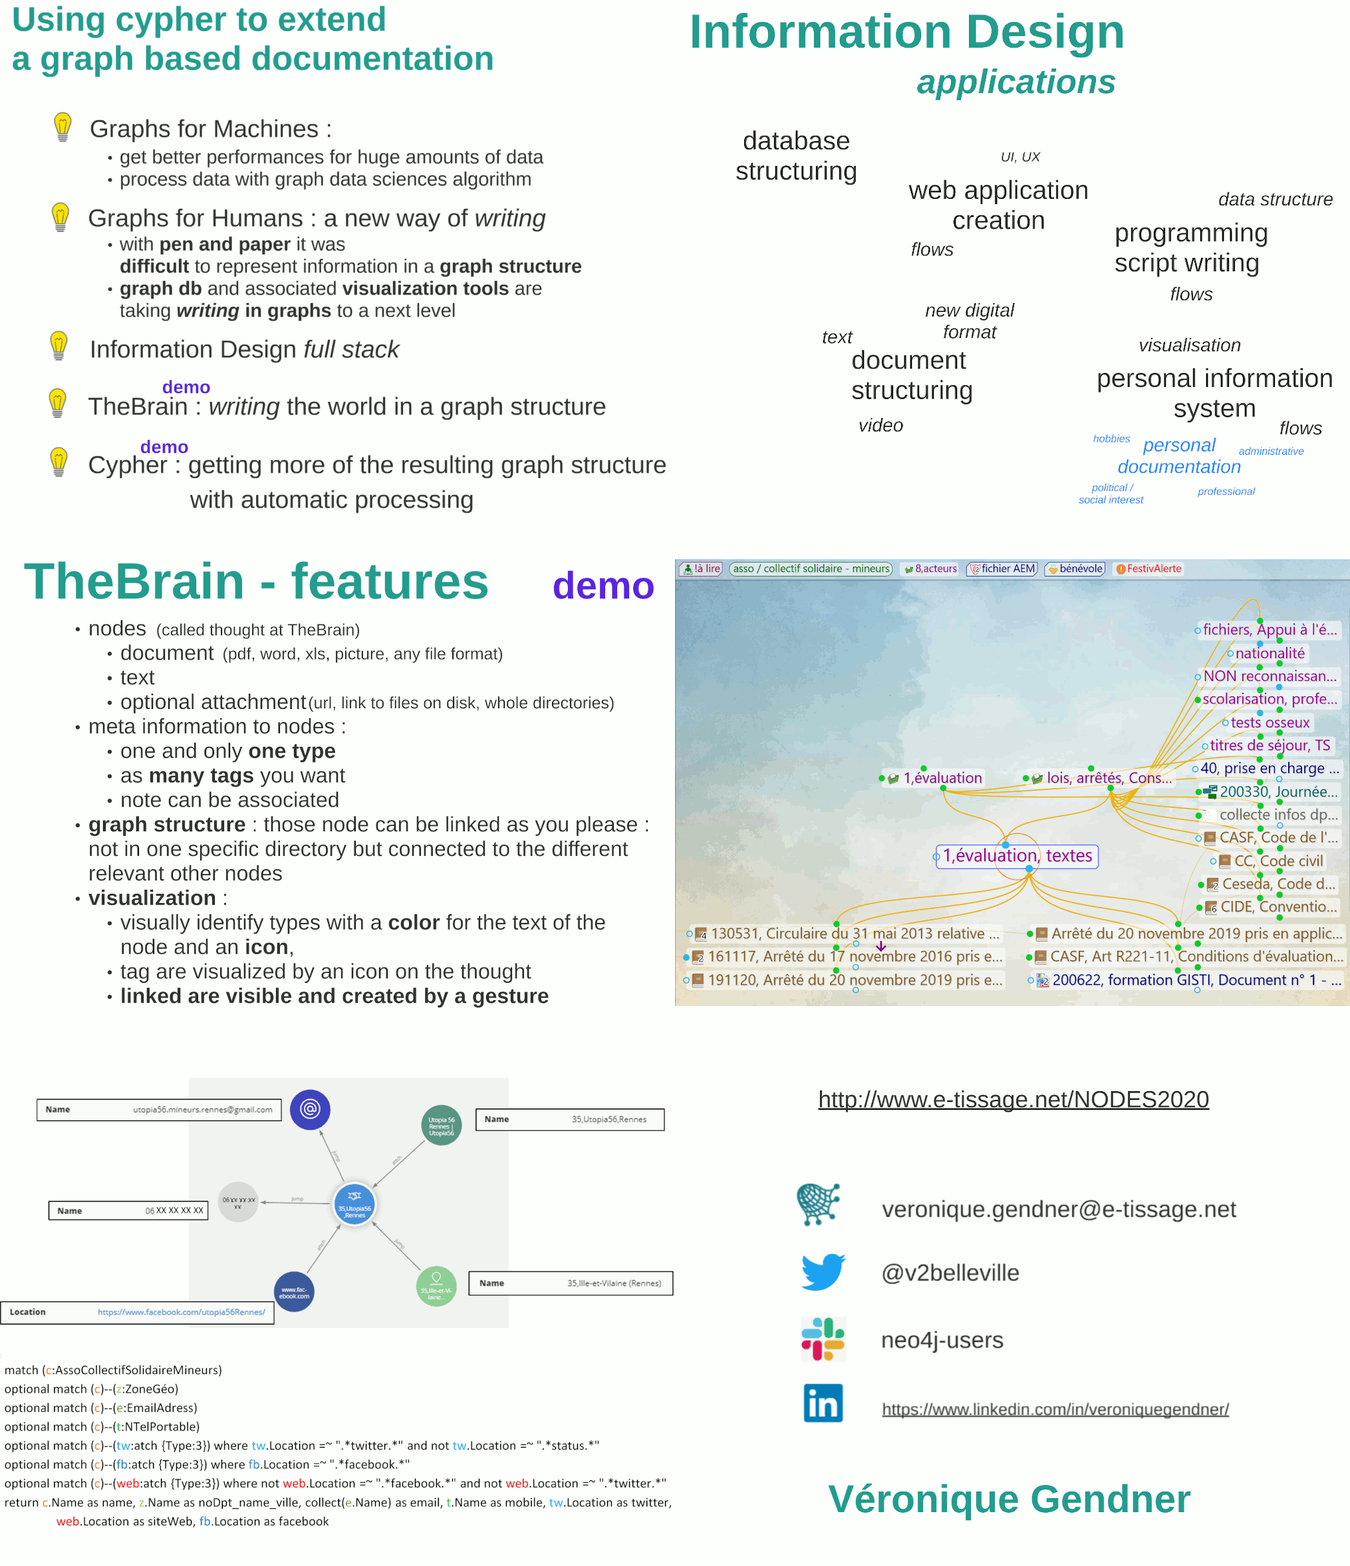
NODES 2020 : Using Cypher to Extend a Graph-Based Documentation
At NODES2020, I’ve presented about graphs for humans : how to manually build a graph structured documentation with TheBrain Technologies, and why this graph writing is so useful.
Also how cypher (Neo4j *) can be used to automatically extract tables or hierarchies needed for specific contexts of use of this documentation.
Along the way, I’ve exposed some ideas about Information Design, the way I see it, that is including all that concerns representation of information but also structuring and the way they are interrelated.

Neo4j for newbies
Introduction videos
Intro to Graph Databases Series (playlist)
Dive right in
Getting started with neo4j in 10 minutes (Excell)
Neo4j sandbox (try it out without installing anything)
In depth learning
Graph academy (free online training)
Getting (seriously) started https://neo4j.com/developer/get-started/
Documentation
Cypher manual (beware of differences if you use 3.5 DB https://neo4j.com/docs/cypher-manual/3.5/)
APOC : essential plugin, in particular for data import https://neo4j.com/docs/labs/apoc/current/
 alerte email - nouveaux articles
 fil RSS - nouveaux articles
 Véronique Gendner, e-tissage.net